Trigger a Flow on a Prometheus Alert
Connect Prometheus alerts to Kestra to trigger flows.
Monitoring with Prometheus and Triggering Flows in Kestra
This guide explains how to connect Prometheus to Kestra and configure a workflow that is triggered by Prometheus alerts. This guide covers the basics and is intended as a starting off point for any production workflows. You will:
- Integrate Prometheus with Kestra
- Configure Prometheus Alertmanager to send alerts via webhook
- Use a Webhook Trigger in a Kestra flow
Connect Prometheus to Kestra
Kestra natively supports integration with Prometheus for metric scraping and visualization. Kestra exposes Prometheus metrics at port 8081 on the endpoint /prometheus. This endpoint can be used by any compatible monitoring system.
Follow these steps based on the Kestra Monitoring Guide.
Once Kestra is up and running, you can check out the available metrics by going to http://localhost:8081/prometheus on your browser.
Configure Prometheus to Scrape Kestra
Add the Kestra metrics endpoint to your Prometheus configuration (prometheus.yml):
global:  scrape_interval: 15s  evaluation_interval: 15s
scrape_configs:  - job_name: "prometheus"    metrics_path: /prometheus    static_configs:      - targets: ["<kestra-host-ip-address>:8081"]
Be sure to put the appropriate localhost:8081 or host.docker.internal:8081. Restart Prometheus for the changes to take effect.
If you’re running everything with Docker on the same machine, you will need to change your host address to host.docker.internal rather than localhost, or the name of the container.
Create a Prometheus Alert and Webhook Receiver
To trigger a Kestra flow on a Prometheus alert, we need to configure Prometheus Alertmanager to send a webhook to Kestra. You can download Alertmanager and Prometheus from the official site as well as run the services in a Docker Compose file, refer below for an example:
services: prometheus: image: prom/prometheus privileged: true volumes: - ./prometheus.yml:/etc/prometheus/prometheus.yml - ./alertmanager/alert.rules:/alertmanager/alert.rules command: - '--config.file=/etc/prometheus/prometheus.yml' ports: - '9090:9090'
node-exporter: image: prom/node-exporter ports: - '9100:9100'
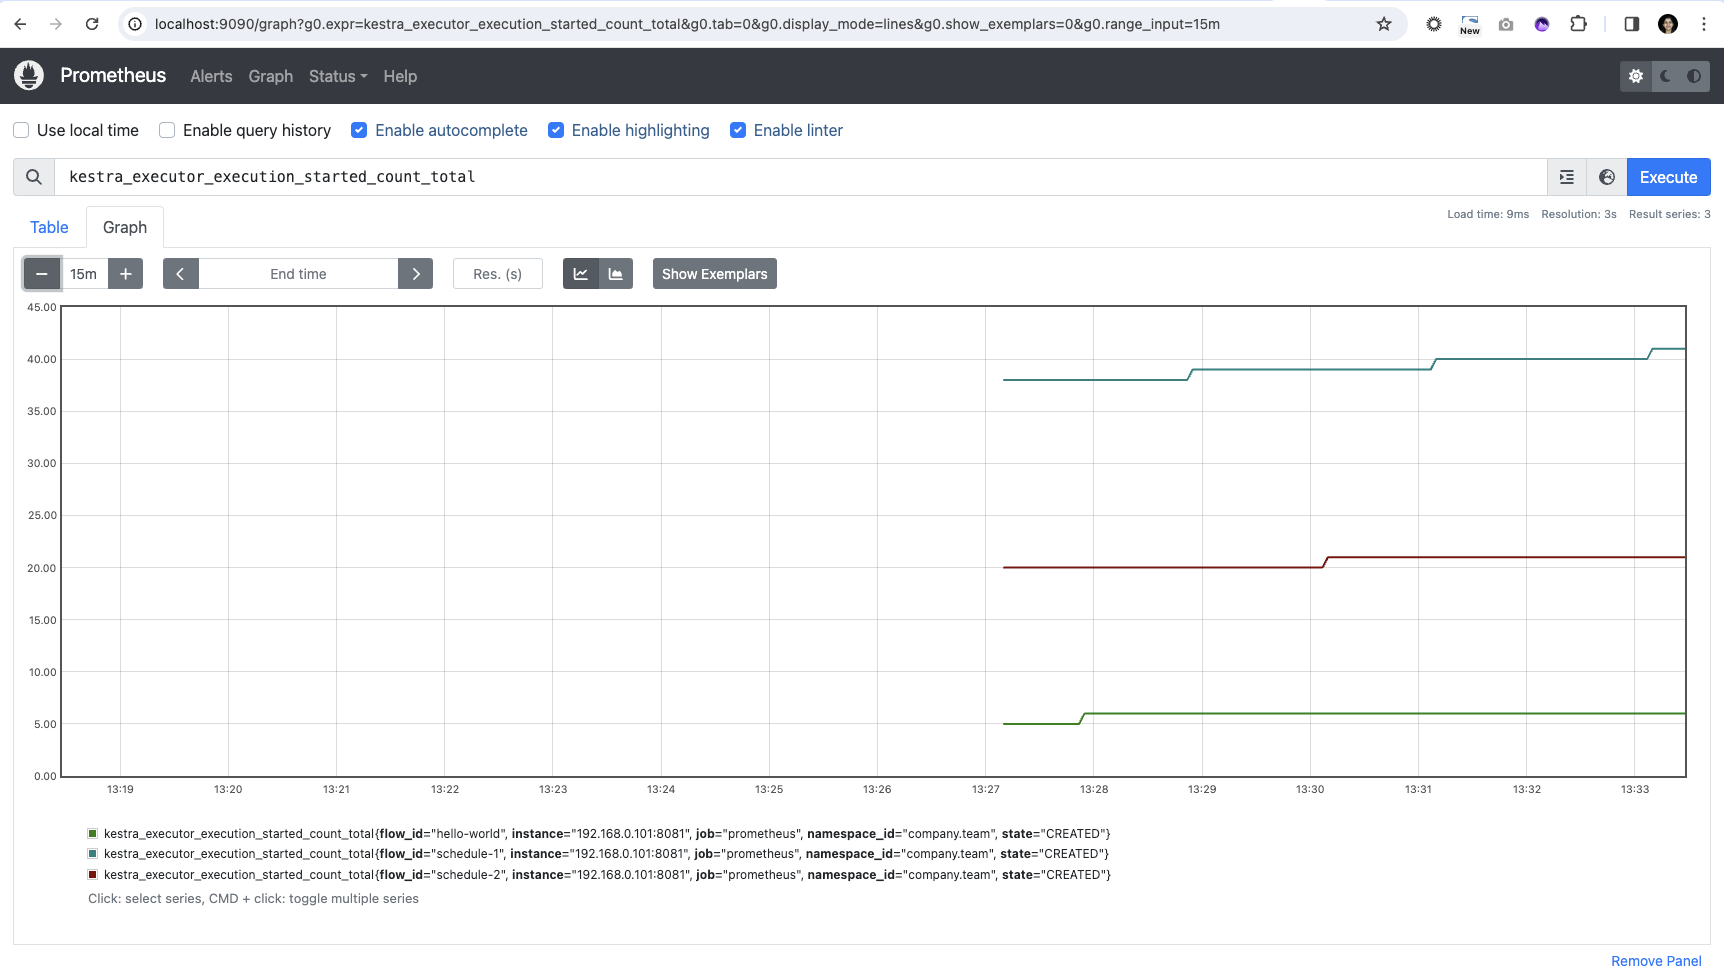
alertmanager: image: prom/alertmanager privileged: true volumes: - ./alertmanager/alertmanager.yml:/alertmanager.yml command: - '--config.file=/alertmanager.yml' ports: - '9093:9093'You can verify Prometheus is up and running by going to http://localhost:9090/graph and visualizing some metrics using the PromQL. Below is one of the graphs for kestra_executor_execution_started_count_total metric:
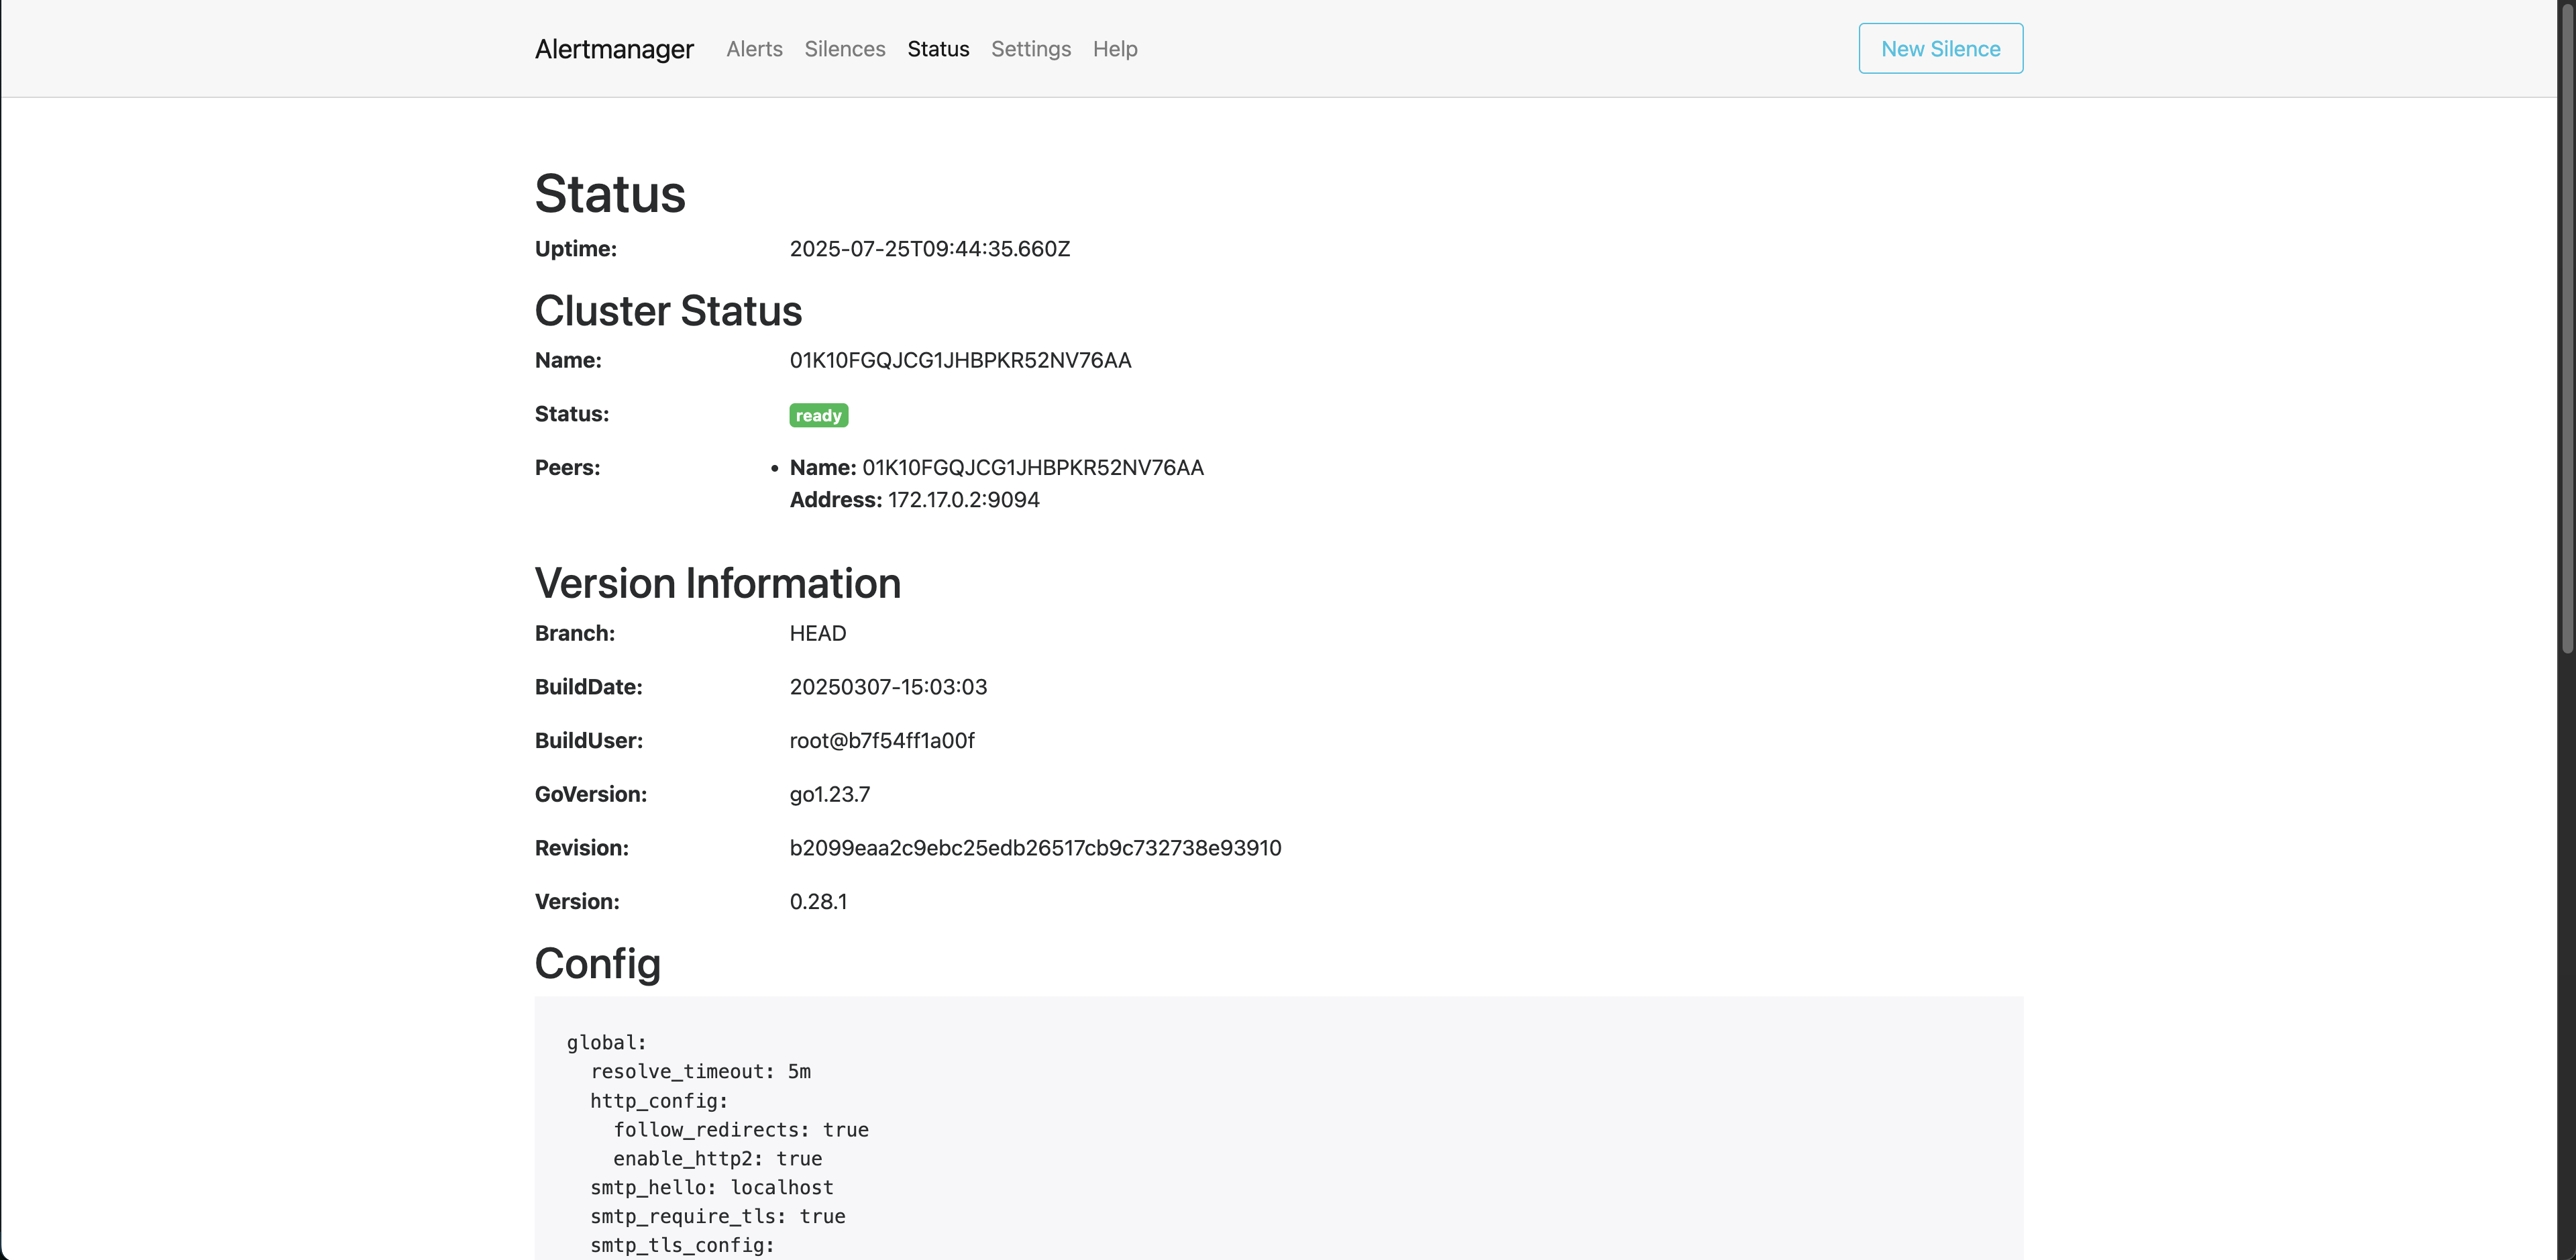
Similarly, you can go to http://localhost:9093/status and see that the Alertmanager is ready.
Step 1: Define a Prometheus Alert
In your prometheus.yml file, you must add Alertmanager and some rules files. For example, the prometheus.yml configuration now looks as follows:
global:  scrape_interval: 15s  evaluation_interval: 15s
scrape_configs:  - job_name: "prometheus"    metrics_path: /prometheus    static_configs:      - targets: ["<kestra-host-ip-address>:8081"]
# Alertmanager configurationalerting:  alertmanagers:  - static_configs:    - targets:      - 'localhost: 9093' # Replace with your host name (i.e., host.docker.internal)
# Load rules once and periodically evaluate them according to global 'evaluation_interval'.rule_files:    - "/alertmanager/alert.rules"
Create a simple rule to alert on high CPU usage or another metric exposed by Kestra. Refer to our full list at Kestra Prometheus Metrics:
groups: - name: alert.rules rules: - alert: HighCPUUsage expr: system_cpu_usage == 1.0 for: 1m labels: severity: "critical" annotations: summary: "High CPU usage on {{ $labels.instance }}"You can also use a simple, generic instance down alert such as:
groups:- name: alert.rules rules: # Alert for any instance that is unreachable for >5 minutes. - alert: InstanceDown expr: up == 0 for: 5mTest different metrics and statuses for what fits your use case. Save these rules in a file such as alert.rules.yml and configure Prometheus to load it like in the above prometheus.yml:
rule_files: - "/alertmanager/alert.rules"Make sure that your groups.name and rule_files have the same name so that Alertmanager correctly connects the alerts.
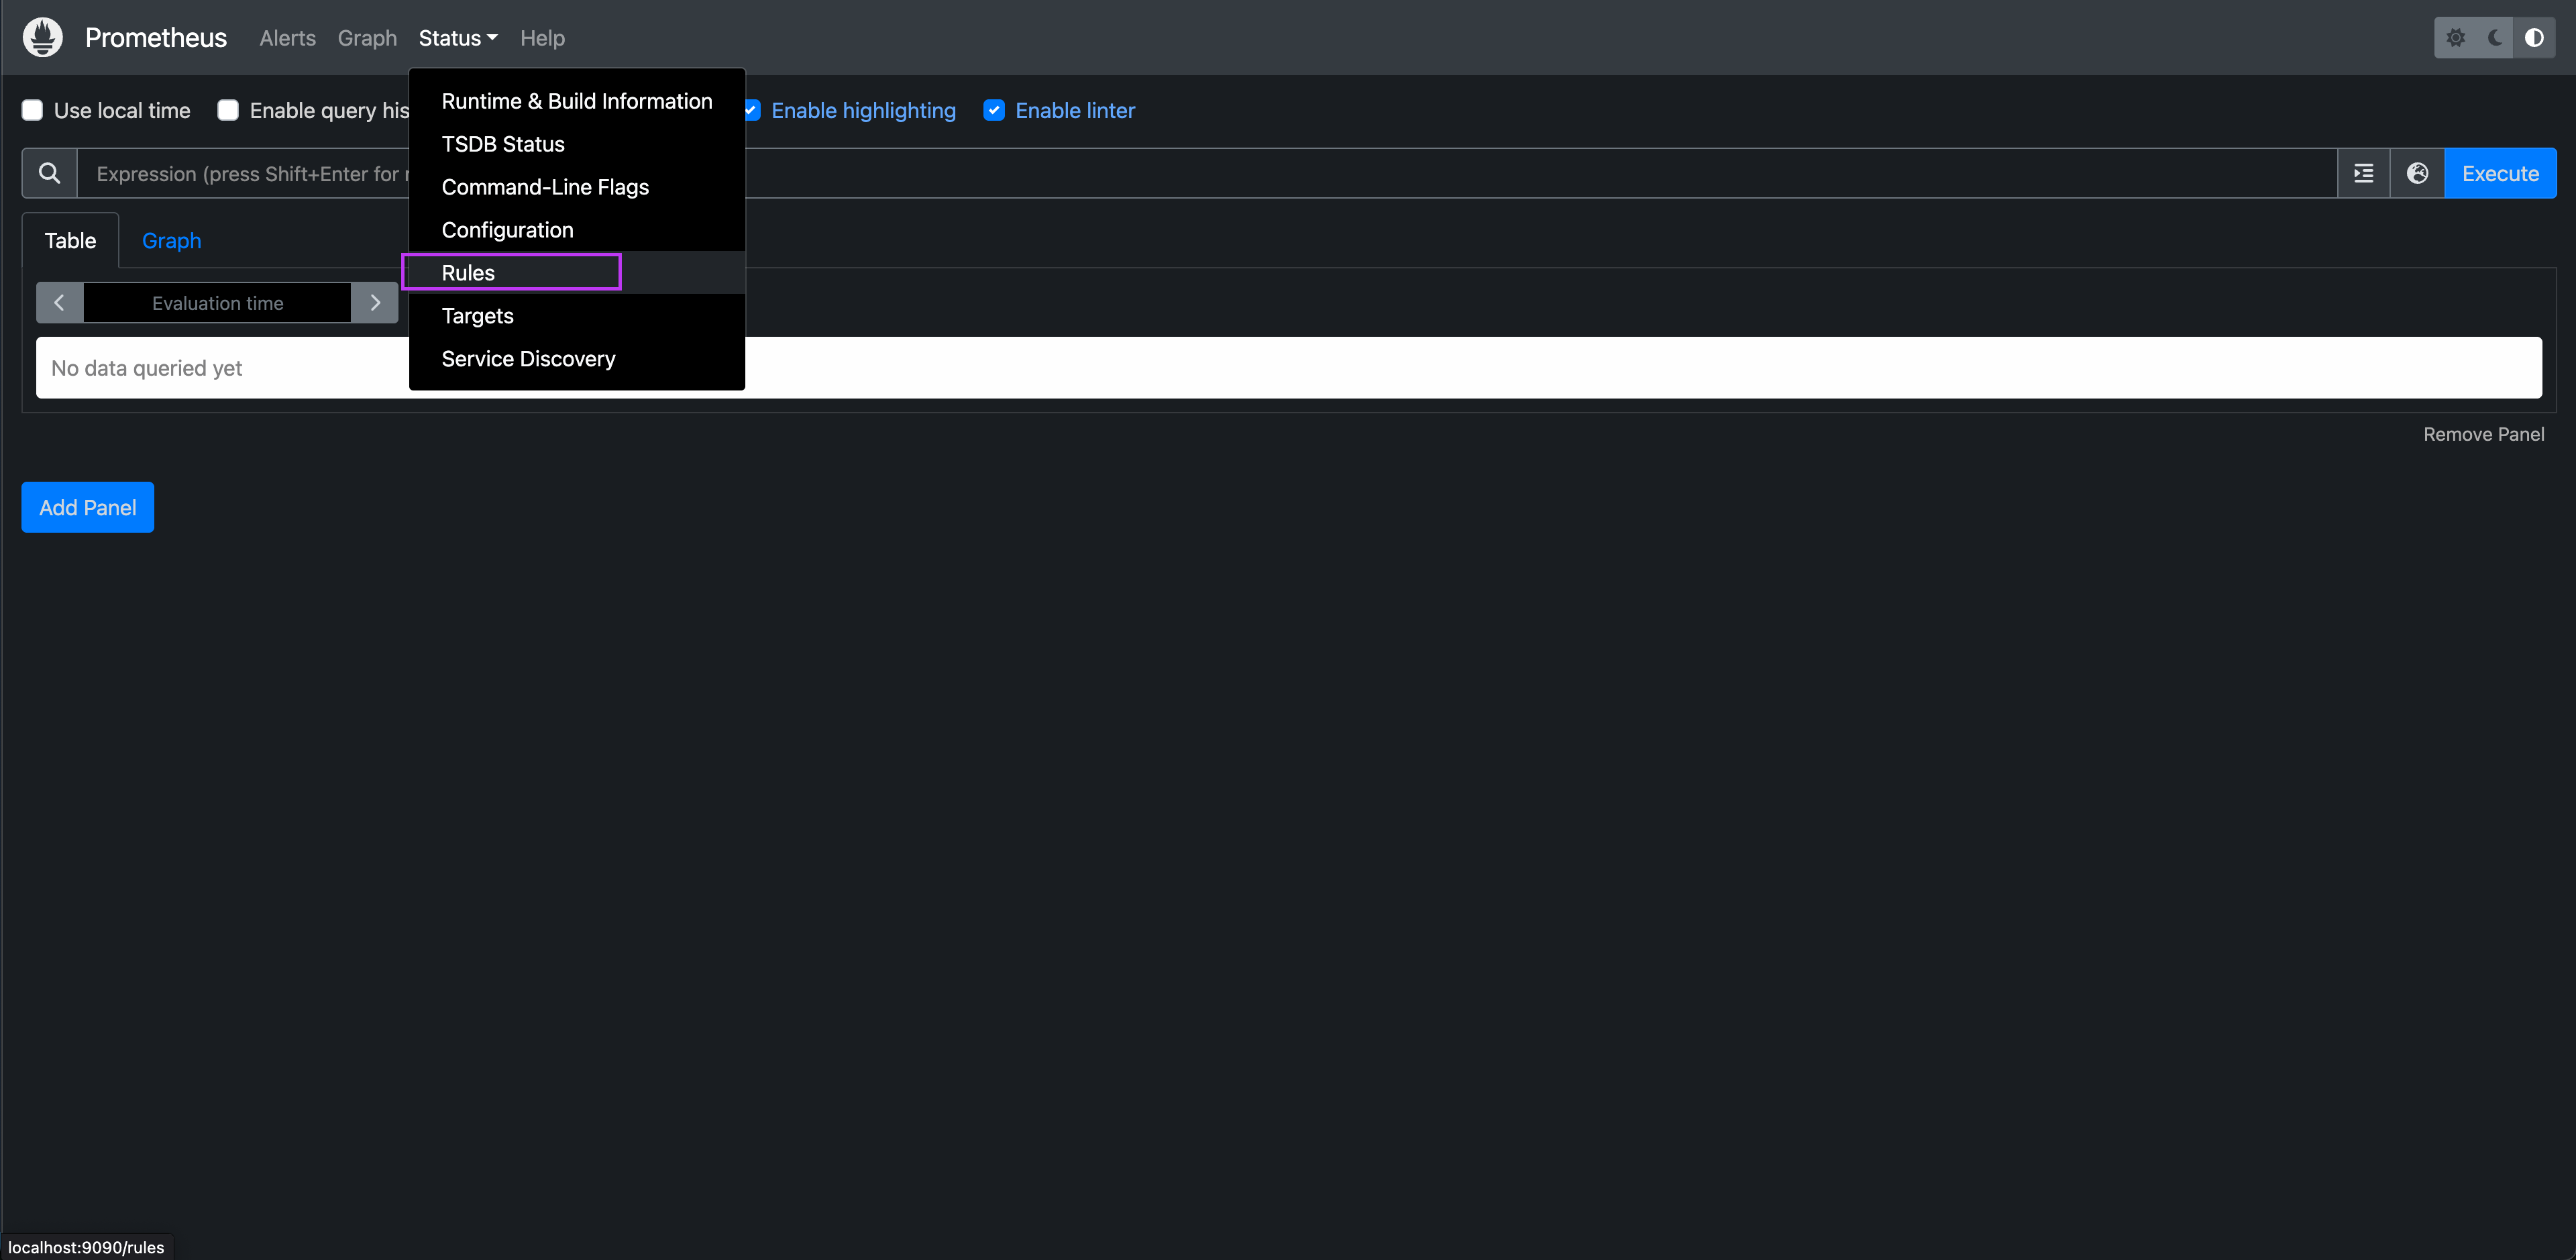
To check that your rules are picked up by Prometheus, go to http://localhost:9090/rules.
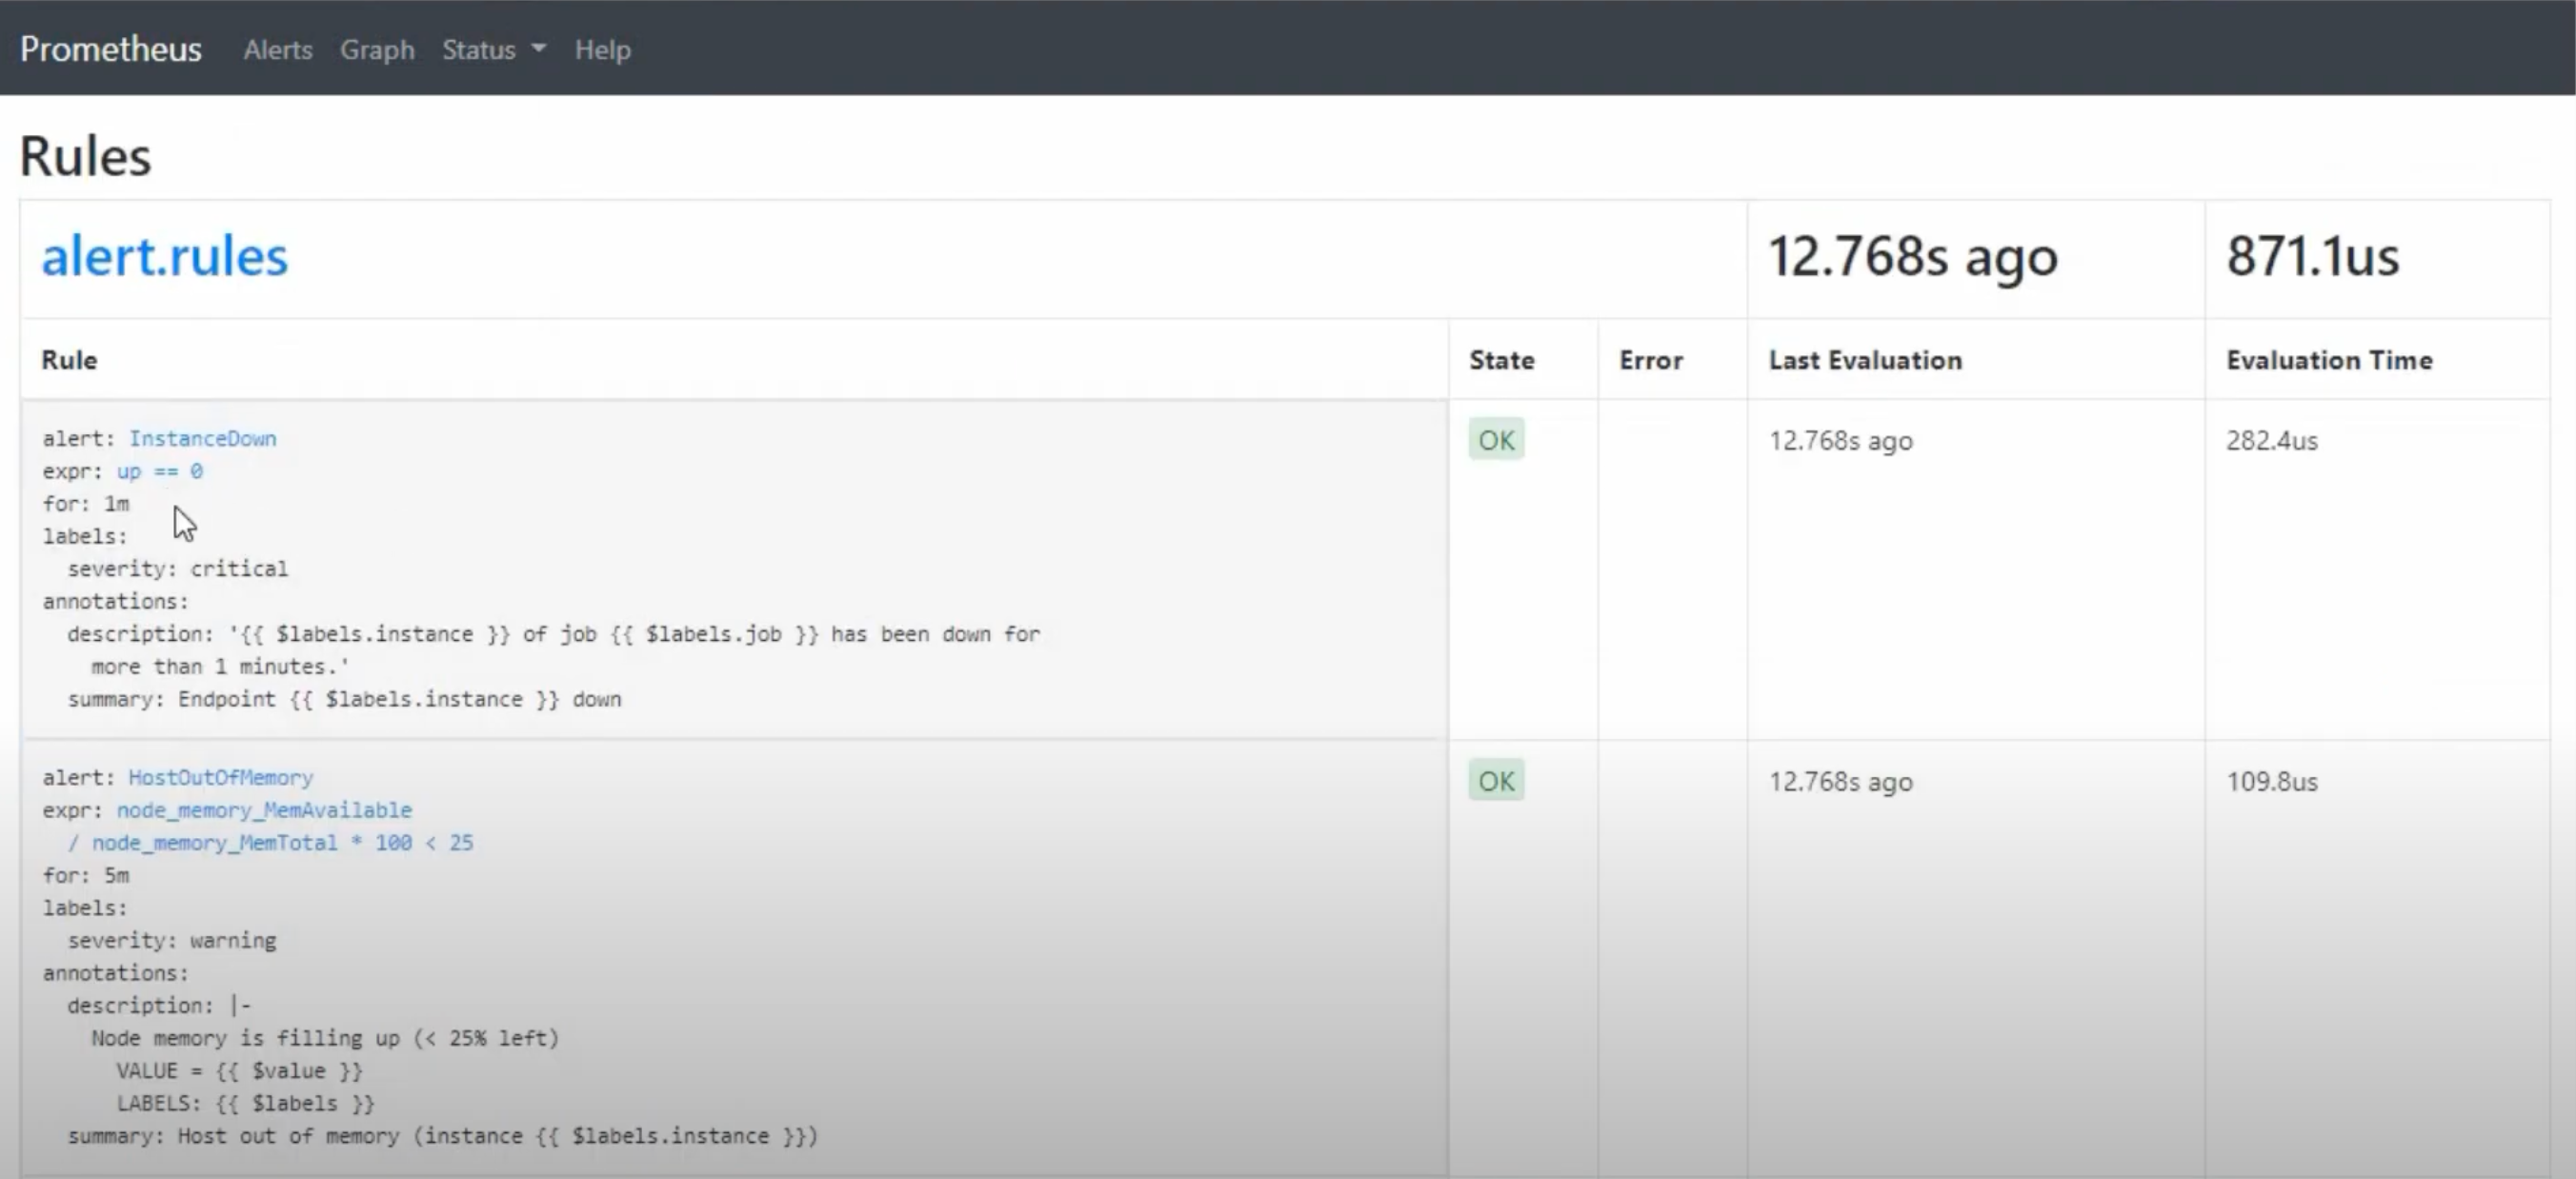
From there, you can see a list of the rules set in the alert.rules.yml file:
Step 2: Configure Alertmanager to Use a Webhook
Now that all the services are connected, edit alertmanager.yml to send alerts to a Kestra webhook:
receivers:  - name: 'kestra-webhook'    webhook_configs:      - url: 'https://<your-kestra-host>/api/v1/triggers/webhook'        send_resolved: true
route:  receiver: 'kestra-webhook'
Ensure your Alertmanager is restarted and using this configuration.
3. Create a Kestra Webhook Triggered Flow
Now create a Kestra flow that is triggered by a Prometheus alert via webhook from the rule definitions specified in the alert.rules.yml file.
Example Flow Definition
id: prometheus-alertnamespace: system
triggers:  - id: from-prometheus    type: io.kestra.plugin.core.trigger.Webhook    key: prometheus
tasks:  - id: log-alert    type: io.kestra.plugin.core.log.Log    message: "Received alert: {{ trigger.body }}"
Once the flow is written, you can verify the trigger is active from the Flows -> Triggers tab in the UI.
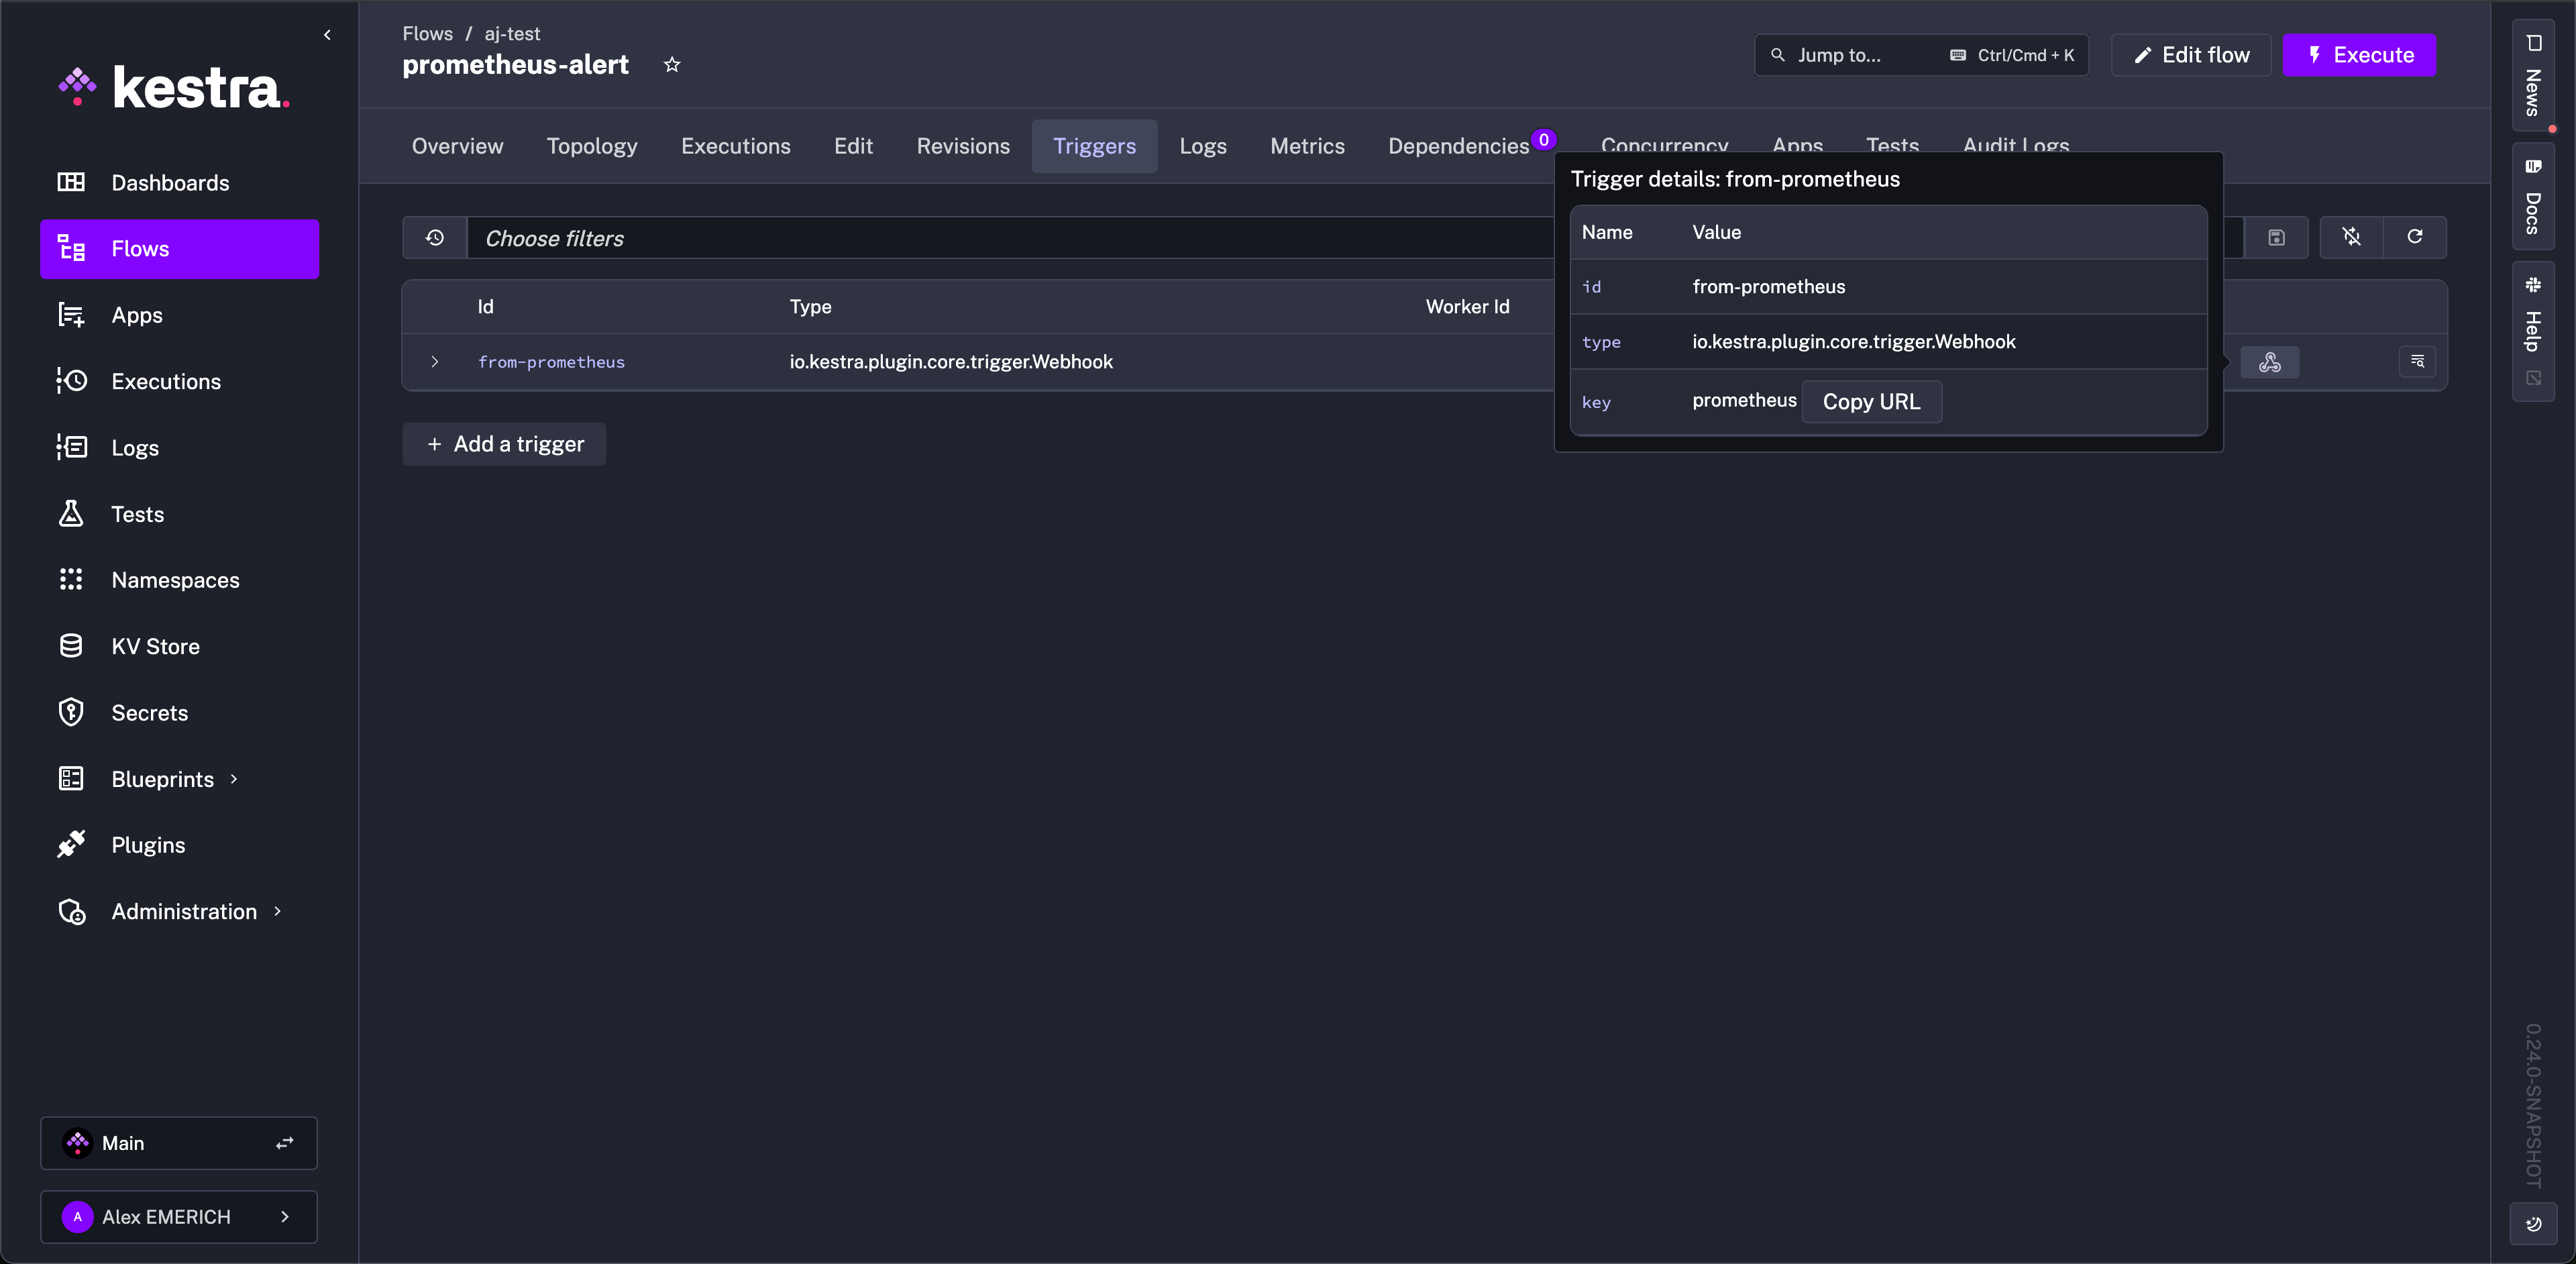
How It Works
-
The
Webhooktrigger listens for HTTP POST requests to:https://<your-kestra-host>/api/v1/triggers/webhook/prometheus
- Prometheus Alertmanager sends alerts to this endpoint.
- The flow is executed with the alert content available as
{{ trigger.body }}.
For more on the Webhook trigger, see the Kestra Webhook Trigger Docs. Again, be sure to check out the full list of metrics Kestra exposes to Prometheus.